Stanford IGC100 Vacuum Gauge Controller
Stanford IGC100 Vacuum Gauge Controller
Control your vacuum system from anywhere in the world

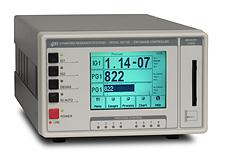
The IGC100 is a high-accuracy vacuum gauge controller that offers pressure measurement and process automation never before available in a single instrument. It measures pressure from Bayard-Alpert ionisation gauges, convection-enhanced Pirani gauges and capacitance manometers providing uninterrupted pressure readings from 1000 Torr to UHV. It has a touchscreen that can display data in a variety of formats including pressure versus time curves. There are built-in relays for process control and several multipurpose input/output ports. The IGC100 is also fully web-ready. Now you can monitor and control your vacuum system from the lab, your home or anywhere in the world.
Features:
- 1000 Torr to UHV range
- Highly accurate, stable controller
- Pressure vs time curves
- 4 analog input/output ports
- RS232 interface
- 8-channel process control
- GPIB and Web interfaces
The IGC100 is designed to be a highly accurate, stable controller. Its low noise, autoranging electrometer delivers high accuracy pressure readings into the UHV range. A low-noise, direct current (DC) supply powers the filament and establishes the emission current. The IGC100's precision electronics eliminate controller-to-controller variations and the measurement uncertainties (up to 15 %) associated with traditional instruments.
The IGC100 has a large, back-lit LCD touchscreen display-new to vacuum gauge controllers. The instrument shows large numeric readings from each gauge (easily read from across the room), and can also display readings in bar graph or trend format. The screen is updated twice a second and results are presented in units of Torr, mbar, bar, Pa or microns. The IGC100 also displays pressure versus time curves (chart recordings), allowing you to follow pump down and venting cycles and to keep track of your vacuum system's performance.
IGC100 data is continuously logged into memory. There is a real-time clock with date for precise time stamps. In addition to pressure readings, you can log the ADC voltages and relay activity. Data can be viewed on the IGC100 or downloaded to your computer for further analysis.
For further information please contact us or download the dataheet.


ICG100 datasheet Read more on Stanford's website